Drawn at $5,000 a pixel, the average top-1% household is a 145-foot stack of bills
The median American household appears as a stack of $100 bills about nine inches tall. Scroll right, and the stacks stop fitting on the screen.
An interactive chart draws US household wealth to scale, one pixel per $5,000 and one column per percent of households. The top 0.1% is 136,095 households, each shown as a stack of $100 bills.
The thread's first fight was not about the picture but about whether wealth is even the right thing to measure.
One pixel is $5,000, and the right edge runs off the page
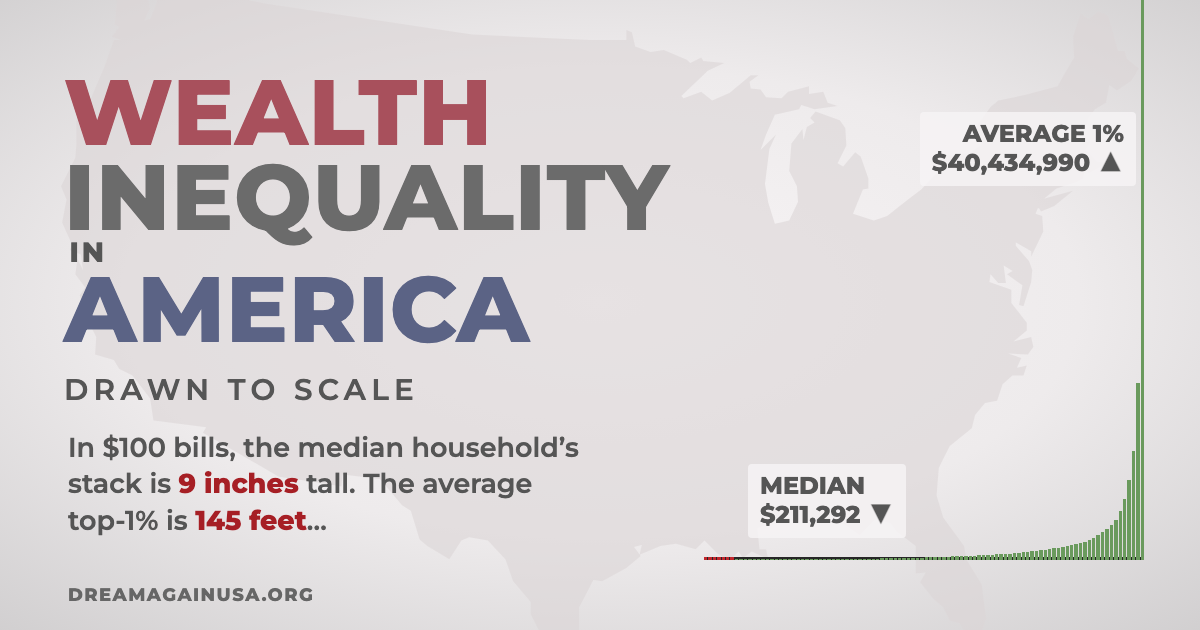
The page draws American household wealth as columns, each representing 1% of households from poorest to richest, with every household pictured as a stack of $100 bills. At that scale the median household is about 9 inches tall; the average top-1% household is about 145 feet. The poorest 8% are shown with their reported debt.
The data are from the 2023 Survey of Consumer Finances, adjusted to 2026 dollars, for the first 99 columns, and the Federal Reserve's Distributional Financial Accounts for the top 1% as of Q1 2026. Two extra bars, "think" and "ideal", come from a 2011 Norton and Ariely study of what people believe the distribution looks like and want it to be.
The thread: is wealth the right yardstick?
Many of the top replies attacked the measure rather than the picture. A commenter who maintains an open-source WebRTC server leaned the other way, taking the chart as an argument for taxation:
"A tiny tax increment to the rightmost column would provide more money than 100 years of all the other pitiful contributions together." — j1elo, maintainer of Kurento WebRTC
Others said the chart mixes very different things. A former startup employee drew on their own options:
"I joined a startup when it was early-stage, stayed for a few years, and exercised my stock options when I left." — solatic, a startup alumnus holding illiquid shares
The comment goes on to say the company is private, the shares diluted and the value unknown, which is why the commenter thinks paper wealth, loans against it and hard assets should be separated. Another reply took on the bottom of the chart:
"I would flatly reject the idea that a just-graduated neurologist with a negative net worth due to loans is "poor"." — twoodfin
And a third questioned why equality should be the goal at all:
"I’m not a one-percenter and my life is great. I don’t even understand why anyone cares about equality." — Roshan George, a self-described non-one-percenter
What the chart can and cannot settle
The picture is vivid about scale but silent on mobility and on what counts as wealth, and the loudest objections were exactly about those two choices. A reader weighing the chart should look at the sources page for how unrealised assets and debts were counted before reaching for a conclusion either way.
Get breakdowns like this every day
The top Hacker News stories, unpacked — by email, Telegram, or RSS.
Best AI agent passes 10.8% of 50 professional tax jobs, and a Sonnet beats Opus
Surge AI built 50 assignments from client email to finished deliverable. Getting 95% of the rubric right turned out to be very hard.